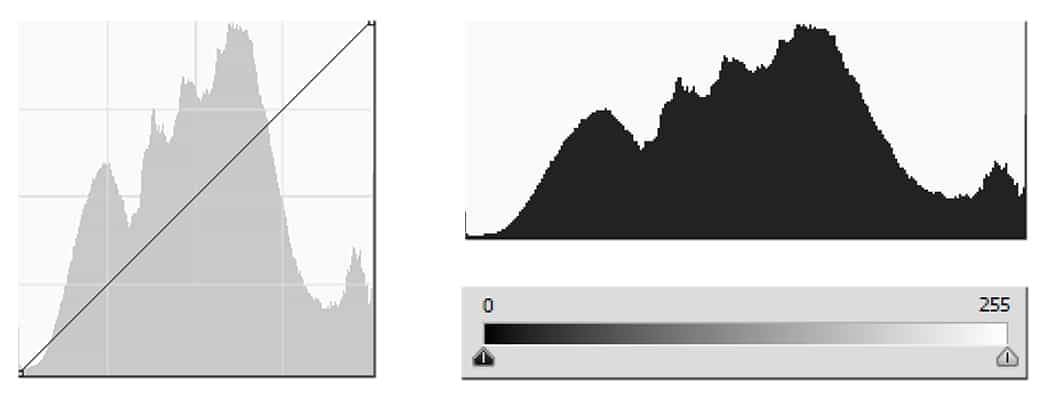
In this webinar I will place a strong focus on three areas that are the most critical to understand when you are editing photographs. They are the Curve, the Histogram, and the Luminance Values of pixels. In the beginning I will cover these topics briefly and then head into the Topaz Product line to show you just how important these topics are that you see everywhere but may not understand.
Once you learn to see these three things while you work and in your work you will begin to take a lot of the guesswork out of photo editing. While they may be quite fundamental in nature, it is surprising how frequently they are overlooked. Here is the breakdown on all three topics:
- The Curve (tone curve): This is a tool used to manipulate the darks, lights and mid tones in a photograph. In Photoshop you can also manipulate the individual color channels in your images with these curves as well. It is an extremely powerful tool, because it also shows the Histogram and (in many programs) the luminance values of the pixels in your photo.
- The Histogram: This is nothing more than a fancy bar graph representation of the amount of pixels present in any one luminance value. When all of these values are put next to one another it creates a wave pattern. Every peak on the histogram is a visual representation of pixels and where they are in your photograph. This is why the histogram does not look like a perfect curve, but more like a series of lines that make up a curve.
- Pixel Luminance Values: Every pixel has a luminance value ranging from 0-255. 0 is pure black and 255 is pure white. 128 is the mid gray value and every other value in between is a shade of gray ranging from the darkest of gray (nearest to black: pixels 1-127) and the lightest gray (nearest to white: pixels 129-254).
To some of the more advanced users out there, this may seem elementary, but in this webinar I am going to show you some advanced ways to approach the curve, histogram, and pixel luminance values!

To go along with this webinar I have a PDF you can download that shows the breakdown of the Curve, the Histogram & Luminance Values. Enjoy!
[hcshort id=”5″]


